Graph drawing teaching resources
Worksheets and lesson ideas to challenge students aged 11 to 16 to think hard about drawing and describing graphs in science (GCSE and Key Stage 3)
You can help students advance their graphing skills by using split screen objectives and focusing on developing discrete skills, one by one. Peer assessment can be a useful strategy to use so that success criteria are made explicit to students.
Avoid falling into the trap of saying, ‘Today we are going to do graphs’. Graphing involves many skills and unless these are explicitly planned for, it may just end up being a case of doing and not learning. This means where possible make sure the curriculum clearly identifies how graph drawing skills progress over time. When teaching any aspect of graph drawing you will want to model carefully what students need to do, either using the whiteboard or visualiser. The ASE Language of Mathematics provides lots of clear guidance on graph drawing.
Plotting points on graphs
Worksheet to teach students how to plot points on a graph. Students draw a picture on graph paper and list its x and y coordinates. These coordinates are passed to their partner who has a go at drawing the picture. This activity can be made more challenging by using a difficult scale. (PDF)
Drawing line graphs and peer assessing
Worksheet on drawing line graphs. This activity is great for any lesson involving line graphs. You can share the incorrect graph on slide 3 and ask students to list all the errors. Depending on how good students are at line graphs they could then practice getting the graph right by plotting the data from the table or, they could just use the mark scheme to peer assess a different line graph. The key purpose of the mark scheme is to make sure students are clear on the specific aspects of graph drawing and so makes the implicit, explicit. (PDF)
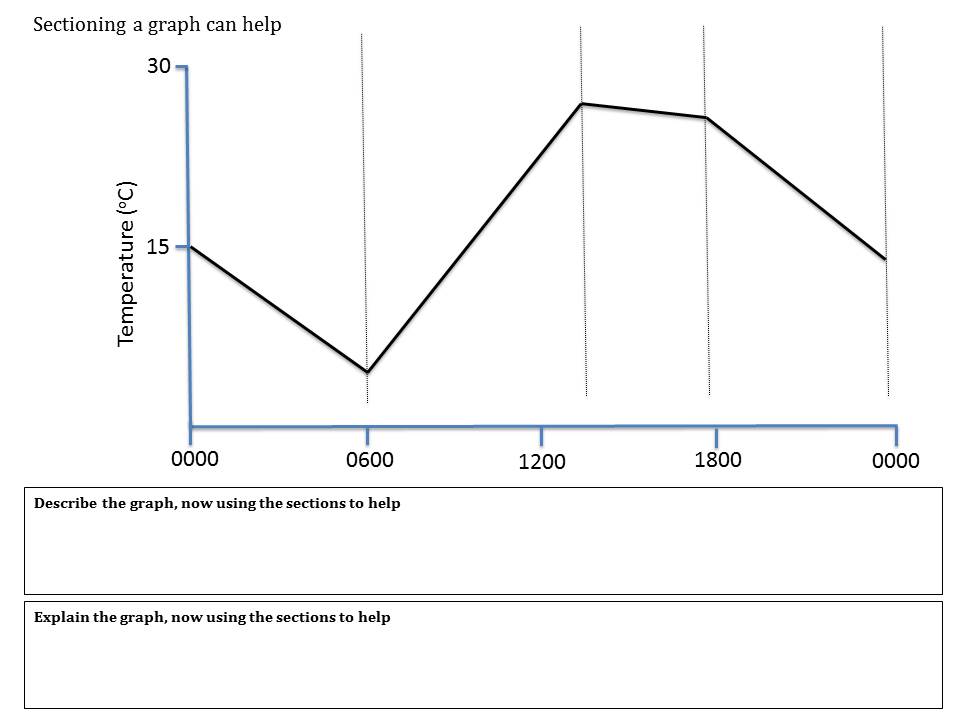
Describing and explaining graphs
Worksheet to teach students how to describe and explain graphs. This is a great way to help students understand the difference between explain and describe. It also shows students how sectioning graphs into discrete stages can support descriptions and explanations. Many students think temperature simply increases and decreases over a 24-hour period. This is a nice misconception to remedy! This resource was made in collaboration with Thomas Kitwood. (PDF)
Correlation does not mean causation
Correlation does not necessarily mean causation. This great website from Tyler Vigen provides some entertaining relationships to discuss and use in your lessons.
Leave a Reply